App LTV in 2026: A Field Guide From Live Accounts
App LTV is the number every growth team quotes and very few trust. Here is how we define it, predict it early and turn it into bidding and budget decisions on the app accounts we run.

Key takeaways
- App LTV is not one number. Define it separately for subscription, ads, in-app purchase and transactional models, and always net of store fees and refunds.
- Early signals from Day 3 and Day 7 usually predict Day-180 value far better than install volume, so pick two or three behaviours and test how well they correlate.
- Payback period is the decision metric. LTV:CAC tells you whether a channel is healthy; payback tells you whether you can afford to keep scaling it.
- Cohort LTV curves, cut by channel, country tier and creative concept, expose where blended averages are hiding losses.
- Feed value back to the ad platforms only after your events are clean, and review the model every quarter against real revenue.
01Why app LTV is the number that decides how fast you grow
Ask ten app founders what their app LTV is and you will get ten confident answers. Ask how each one was calculated and the confidence usually fades. One counts gross revenue, another nets out store fees, a third uses a twelve-month horizon on an app that is only eight months old. The numbers look precise and mean very different things.
That matters because LTV is the ceiling on what you can pay for a user. Every bid, every budget increase and every new channel test is really a bet that the users you buy will be worth more than they cost, within a time frame your cash position can survive. Get LTV wrong by 30 percent and your entire paid plan is built on sand.
On the app accounts we manage, the teams that scale calmly are not the ones with the highest lifetime value. They are the ones who know their value early, trust it, and change spend quickly when it moves. This guide covers how we get there: clear definitions per business model, early prediction, payback targets, cohort curves and how to put the number to work inside campaigns. It sits alongside our wider app marketing service, because LTV touches every other decision we make for a client.
02How to define app LTV for each business model
The single most common error we inherit is one formula applied to every app. A meditation subscription, a puzzle game and a food delivery app earn money in completely different shapes, so their lifetime value has to be built differently.
| Model | What counts as revenue | Main LTV drivers | Typical trap |
|---|---|---|---|
| Subscription | Net subscription revenue after store fees, refunds and trial cancellations | Trial start rate, trial to paid, renewal rate by plan length | Counting annual plans as full value on day one |
| Ad supported | Ad revenue per user from your mediation and ad network reports | Sessions per day, ad impressions per session, retention | Using an average eCPM that ignores country and format mix |
| In-app purchase | Net purchase revenue after store fees and refunds | Payer conversion, repeat purchase, size of top spenders | A handful of heavy spenders distorting the average |
| Transactional | Contribution margin per order, not order value | Order frequency, basket size, discount cost, delivery cost | Using gross merchandise value instead of margin |
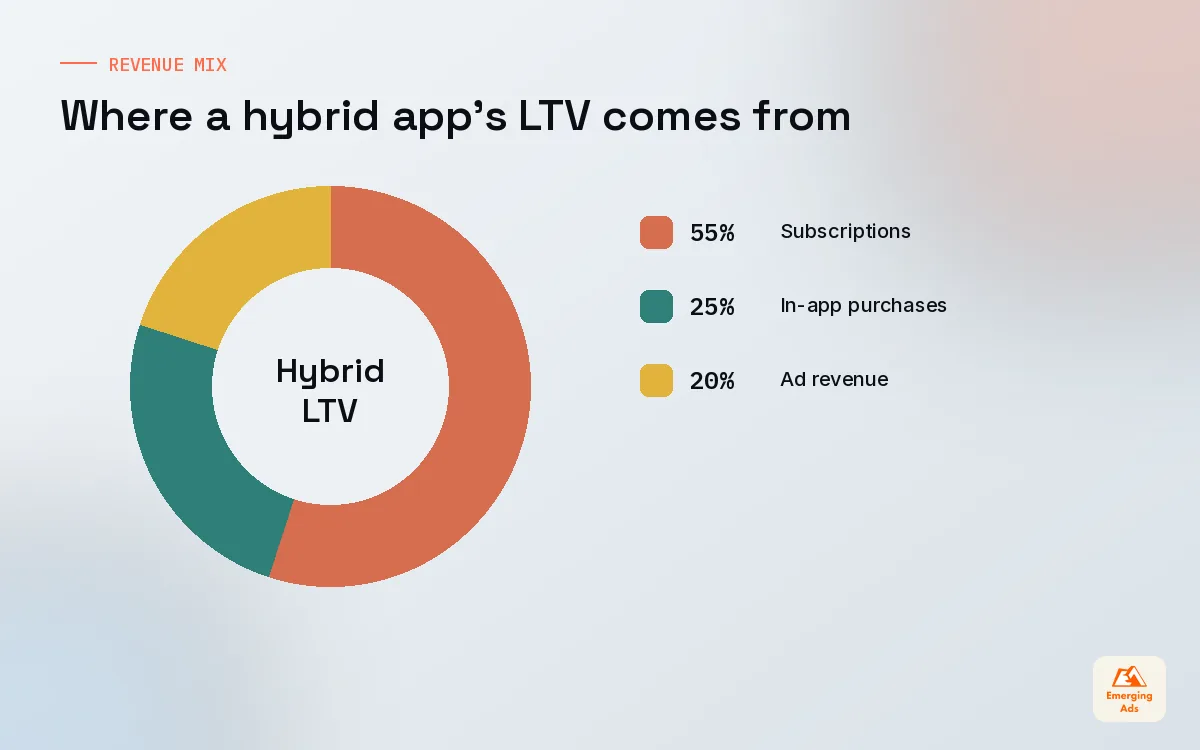
| Hybrid | Sum of the streams above, each netted properly | Mix of payers and ad viewers in each cohort | Double counting a user who both pays and sees ads |
Subscription apps
For subscription products we build LTV from three rates: trial start, trial to paid conversion and renewal by plan length. Annual plans should be recognised as cash, not as value that arrives the day the trial converts and never leaves. If refunds are common in your category, net them out at the cohort level. We set this up on subscription and SaaS accounts with the same discipline, because the maths of recurring revenue is the same whether the product lives in an app or a browser.
Ad supported and hybrid apps
Ad revenue LTV lives or dies on user level ad revenue data. Averages hide the fact that users from higher value markets and users who play longer sessions earn very different amounts. Where possible, pull impression level revenue into your analytics so you can see value per user rather than value per day. For hybrid apps, keep the streams separate until the final sum so you can see which one a channel is actually driving.
Transactional and marketplace apps
Delivery, ride and marketplace apps should measure contribution margin, not order value. A user who orders every week with a heavy discount can be worth less than one who orders monthly at full price. If the finance team and the growth team are not using the same margin definition, settle that first.
03How to calculate app LTV without fooling yourself
There are two honest ways to calculate lifetime value for an app, and one dishonest one that looks very similar.
- Observed cohort LTV. Take everyone who installed in a given week, add up their net revenue to date, divide by the number of installers. Repeat at Day 7, 30, 90 and 180. This is slow but it is real money.
- Modelled LTV. Use observed curves from older cohorts to project where a young cohort will land. This is fast and it is what you bid on, but it is only as good as the history behind it.
- The trap: formula LTV. ARPU divided by churn, or average revenue multiplied by an assumed lifetime. These shortcuts treat every user as identical and assume churn stays flat forever. They nearly always overstate value for young apps.
We use the first to keep ourselves honest and the second to make decisions. The third only appears in investor decks we did not write.
Pick a horizon and stick to it
Lifetime is a misleading word. Nobody waits a lifetime for money back. We agree a working horizon with each client, usually Day 180 or Day 365, and call the result LTV180 or LTV365. Shorter horizons are less exciting and far more useful, because they line up with how long the business can wait for its money.
Net revenue, always
Store commission, refunds, chargebacks, payment fees and, for transactional apps, delivery and discount costs all come out before we call anything LTV. Teams that skip this step routinely find their real margin is a third lower than the dashboard suggests.
04Predicting app LTV from Day-3 and Day-7 signals
Waiting 180 days to learn whether a campaign worked is not an option when you are spending every day. So the real skill in managing app LTV is prediction: finding the early behaviours that reliably separate valuable users from tourists.
On most accounts we find two or three behaviours that carry most of the signal. The work is to find yours, not to borrow someone else’s.
| App type | Early signals we test first | Window |
|---|---|---|
| Subscription | Trial started, key feature used twice, notifications allowed | Day 0 to Day 3 |
| Game | Levels completed, sessions on Day 1 and Day 2, first purchase or rewarded ad view | Day 0 to Day 7 |
| Fintech | Account verified, first deposit, second transaction | Day 0 to Day 7 |
| Ecommerce or marketplace | Second session, item saved, first order | Day 0 to Day 7 |
| Health and fitness | Plan set up, three workouts or logs in week one | Day 0 to Day 7 |
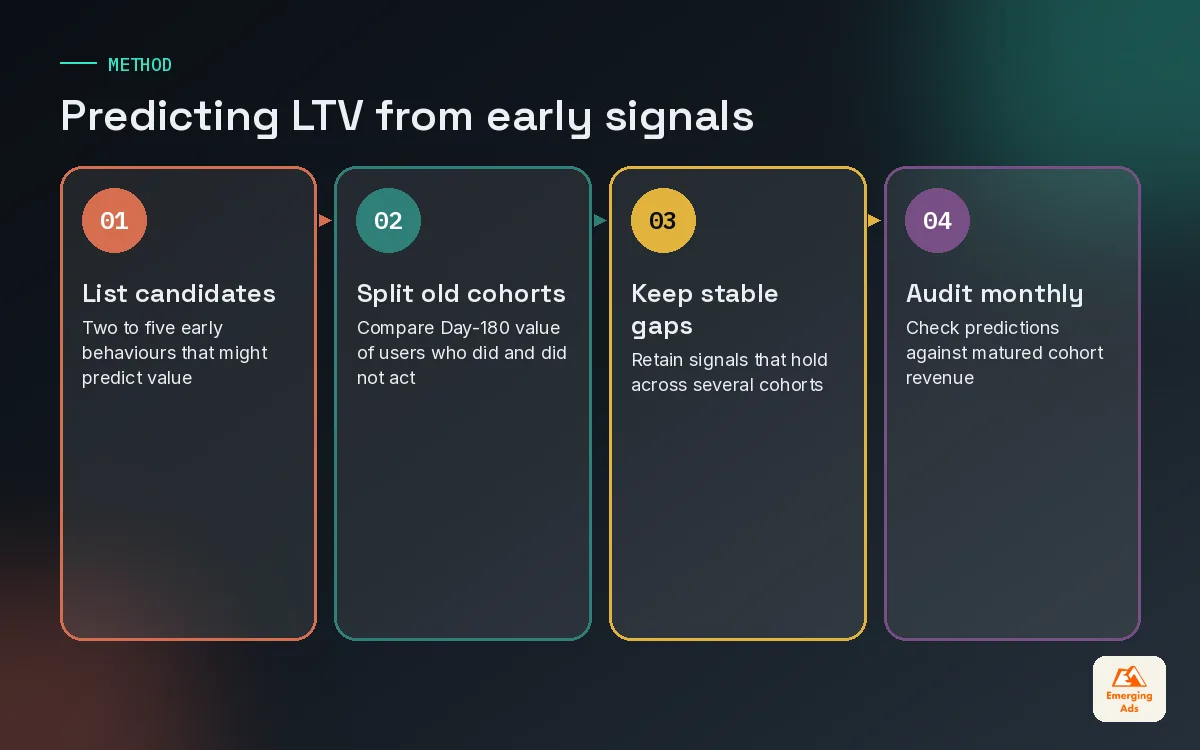
Signals in this table are starting points we test, not universal rules. To pick yours, take cohorts that are old enough to have mature revenue, split each one by whether users hit a candidate behaviour, and compare their Day-90 or Day-180 value. A good signal shows a large, stable gap across several cohorts. A behaviour that looks strong in one month and weak in the next is noise.
Building a simple predictive model
You do not need machine learning on day one. A spreadsheet that multiplies the share of users who hit each early signal by the historical value of those users gets most teams 80 percent of the way. Once the events are reliable in a tool like Mixpanel or Amplitude, our product analytics team can build regression or curve fitting models that update weekly. Retention is the engine underneath all of this, which is why our app retention guide is the natural companion to this one.
Measure the model itself. Every month, compare what it predicted for cohorts that have now matured with what they actually earned. A model that drifts by more than 15 to 20 percent needs new inputs, not more faith.
05Payback period: the metric that actually controls spend
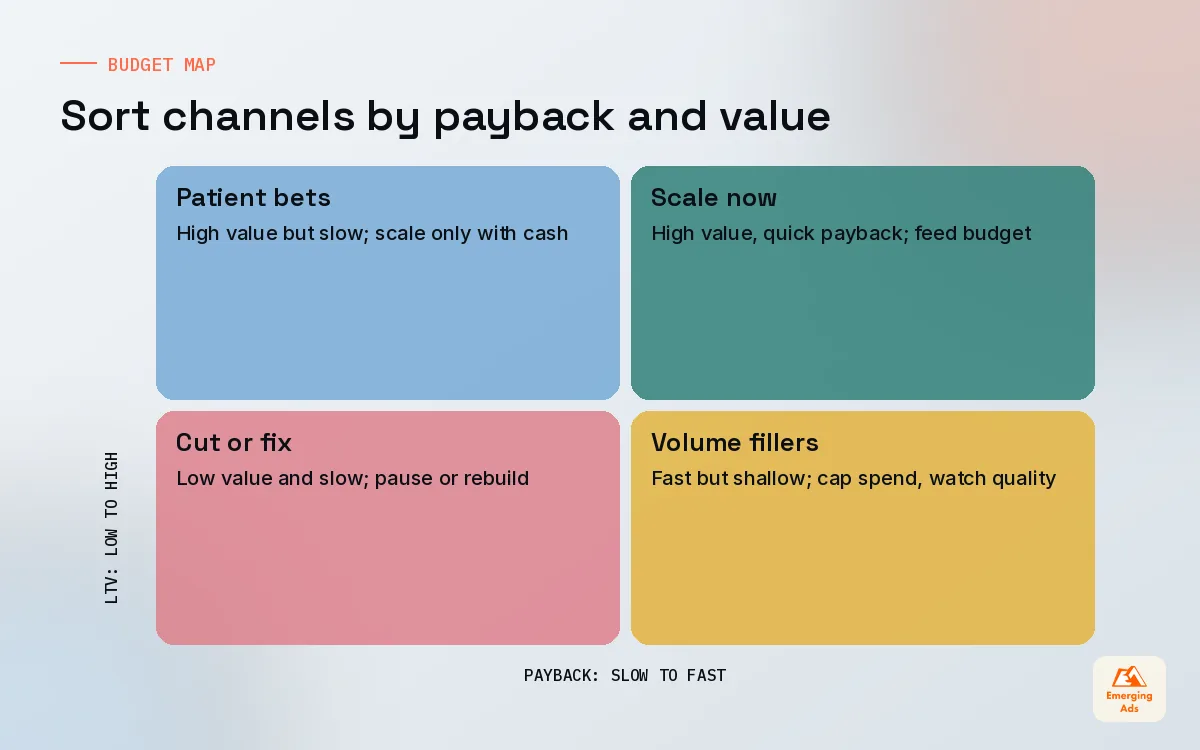
LTV tells you what a user is worth eventually. Payback period tells you when you get your money back. For anyone without unlimited capital, the second question decides how hard you can push.
We calculate payback per cohort as the number of days until cumulative net revenue per user equals the cost to acquire that user. Most of our clients set a target window based on cash position and model, then manage channels against it.
| Business stage | Typical payback target we agree | Why |
|---|---|---|
| Pre revenue proof | Under 30 to 60 days | Cash is tight and the model is unproven |
| Early scale | 60 to 180 days | Model is proven on a few channels, testing new ones |
| Funded growth | 180 to 365 days | Capital allows longer recovery for larger volume |
| Mature, profit focused | Under 90 days | Priority shifts to efficient, repeatable returns |
These ranges are illustrative of conversations we have with clients, not industry benchmarks. Your own target depends on margin, cash and how confident you are in the curve.
Payback by channel, not just blended
A blended payback of 120 days often hides one channel paying back in 40 days and another that never will. We break it down by network, campaign type and country tier before deciding where the next pound goes. When we run app install campaigns for clients, the weekly review starts with payback by source, not cost per install.
A cheap install that never pays back is the most expensive user you will ever buy.
06LTV to CAC ratio for apps, and when it misleads
The LTV:CAC ratio is useful shorthand. Divide lifetime value by customer acquisition cost and you get a quick read on whether a channel creates or destroys value. A ratio of 3:1 is often quoted as healthy, but treat it as a conversation starter rather than a rule.
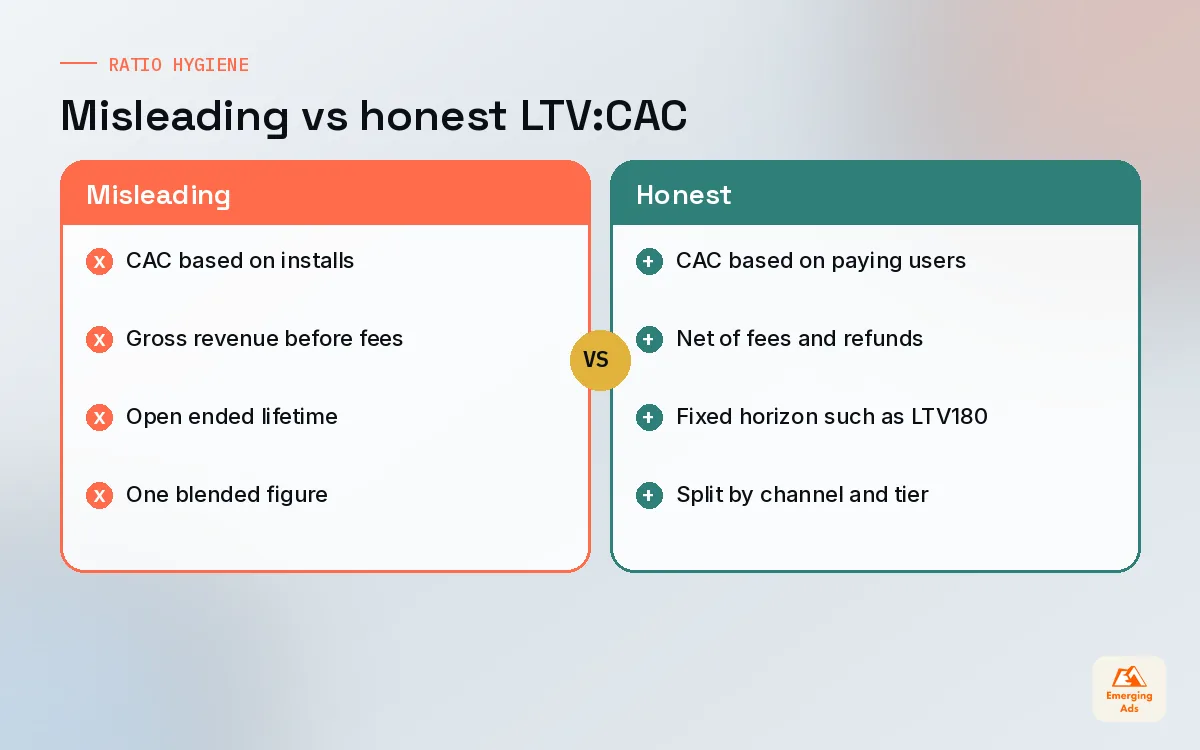
The ratio misleads in three common situations:
- When CAC uses installs, not customers. For subscription apps, divide spend by paying subscribers, not by installs. Otherwise the ratio flatters every channel that drives cheap, low intent downloads.
- When LTV is gross. A ratio built on revenue before store fees and refunds can look healthy while the business loses money on every user.
- When the horizon is too long. A 4:1 ratio on a three year horizon is far weaker than 2:1 within six months if you need cash to keep going.
We report LTV:CAC and payback side by side. If they disagree, payback wins, because it includes time and cash. Getting the CAC side right depends on clean attribution, which is a large part of why we put so much effort into attribution modelling before trusting any ratio.
07Reading cohort LTV curves the way a media buyer does
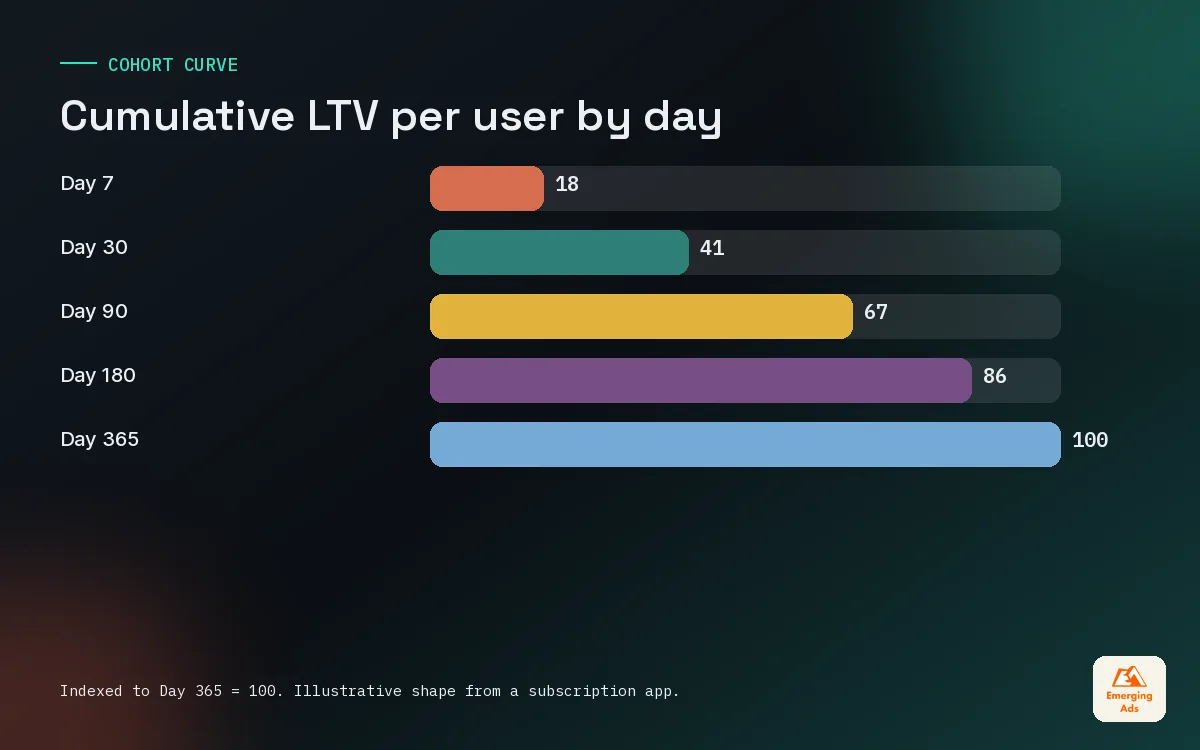
A cohort LTV curve plots cumulative net revenue per user against days since install. It is the single chart we look at most on app accounts, because its shape tells you more than any one number.
Three shapes and what they mean
- Steep early, flat later. Typical for games and transactional apps where most value arrives in the first weeks. Payback decisions can be made early, and retargeting may lift the tail.
- Step shaped. Typical for subscription apps with monthly or annual renewals. Each renewal date creates a jump; the size of the jump shows renewal health.
- Slow and steady. Common for ad supported utilities. Value builds daily with retention, so small retention gains compound into large LTV gains.
Cut the curve before you trust it
Blended curves hide the story. We cut every curve by channel, campaign objective, country tier, platform and creative concept. On one fitness subscription account, the blended Day-90 curve looked flat and disappointing. Split by creative concept, it turned out that two demo style concepts produced users worth nearly twice as much as a discount led concept that drove the most installs. We moved budget accordingly and the blended curve recovered within two months.
We build these curves in a Looker Studio dashboard fed from the MMP and the analytics tool so the growth team, finance and the founder all look at the same chart every Monday. Getting MMP data into that view cleanly is covered in our mobile measurement partner guide.
08Using app LTV in bidding and budget decisions
A model that lives only in a spreadsheet changes nothing. The value appears when LTV shapes what the ad platforms optimise for and where your budget goes each week.
Choosing the right optimisation event
Most networks let you optimise for installs, for a specific in-app event, or for value. Our rough ladder is to start on an event that correlates with value and fires often enough to exit learning, then move to value optimisation once purchase or revenue events are frequent and accurate. On Meta app campaigns that usually means beginning with a trial or first purchase event, then testing value optimisation once volume allows.
Sending predicted value back
Some advanced setups send a predicted value event at Day 1 or Day 3, so the platforms can learn from LTV signals long before real revenue arrives. It works well when the prediction is honest and poorly when it is inflated. If you go this route, cap predicted values at realistic levels and audit them against actual revenue every month.
Setting bids and budgets from LTV
- Start with your predicted LTV at the payback horizon you agreed.
- Multiply by the share of that value you are willing to spend to acquire a user. This is your maximum cost per paying user.
- Translate it into the metric each campaign optimises for, using your observed conversion rates from install to that event.
- Use the result as a target cost or ROAS goal, and leave room for the platform to find volume.
- Review weekly. If a cohort is tracking ahead, loosen; if it is behind, tighten before scaling.
Retargeting and lifecycle work raise LTV after the install, which means they raise what you can afford to bid. App retargeting and well built email automation flows for lapsed trial users are two of the cheapest ways we know to move the curve upward.
09An app LTV checklist and where to go next
Before you raise budgets on the strength of an LTV number, run through the checklist below. If you cannot tick most of it, your next pound is better spent on measurement than on media.
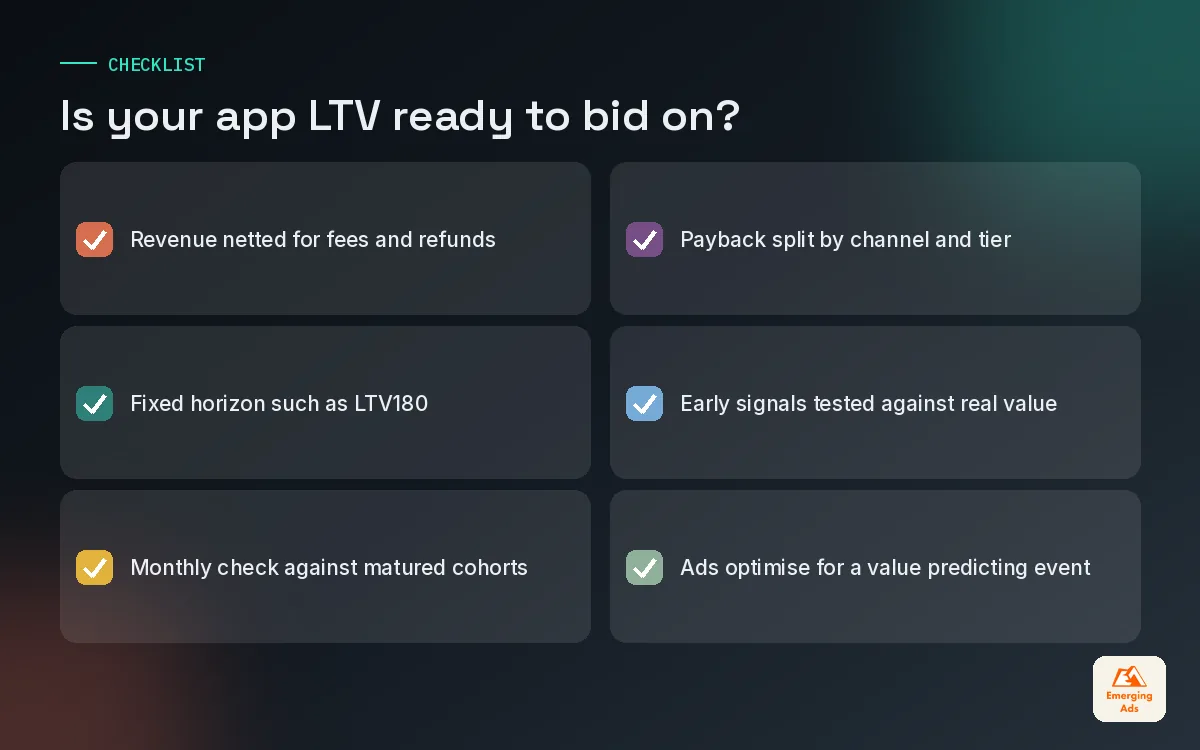
- Every revenue stream is netted for store fees, refunds and costs.
- LTV has a stated horizon, such as LTV180, not a vague lifetime.
- The model is checked monthly against cohorts that have matured.
- Payback is reported by channel and country tier, not only blended.
- Early signals have been tested against real Day-90 or Day-180 value.
- The ad platforms are optimising for an event that actually predicts value.
App LTV is less glamorous than creative or new channels, but it decides how hard everything else can push. If you want help building or pressure testing yours, see our full list of EmergingAds services, or start from the youremergingads.com homepage to read the rest of our app growth series. For a view on what you should expect to pay for users in the first place, our main site breakdown of app install campaign costs is a useful next read.
Frequently asked questions
Straight answers to what clients ask us most about app ltv.
What is app LTV?
How do you calculate app LTV?
What is a good LTV to CAC ratio for an app?
How early can you predict app LTV?
What is the difference between LTV and ARPU?
Should app LTV include store fees?
What is payback period in app marketing?
How does retention affect app LTV?
Can I optimise ad campaigns for LTV directly?
Why does my LTV model keep being wrong?
Which tools do I need to track app LTV?
Is your app LTV model strong enough to bid on?
We will review your cohort data, events and payback targets, then show you where the model is guessing and how to make it something you can scale on.
Book your free audit